Adaption and Mitigation to climate change

So far, there have been few risk analyses concerning the impacts of climate change in Finland. In the European Environment Agency report ‘Vulnerability and adaptation to climate change in Europe’, agriculture and forestry are the only sectors for which Finland has specified some vulnerabilities.

Finland is Europe’s most heavily-forested country. Based on Boreal Forests Forests cover 23 million hectares or 74.2% of the land area. Finland had over sixteen times more forest per capita than in European countries on average. Finland’s forest policy aims at sustainable forest management based on the information I got from the unfccc. The aim is to ensure the welfare founded on the use of forests and diversity of the forest nature (Forests, trees and soil, absorb a signicant proportion of the carbon dioxide emissions). Policy measures include the Forest Act and other legislation, Finland’s National Forest Programme 2015, financing and public forestry extension organizations. Finnish forests are managed in a sustainable manner. About one third of the forests are regenerated naturally and two thirds artificially. According to the Forest Act, a new seedling stand has to be established within three years after the end of felling. Natural regeneration is based on seeding from trees already growing on the site, usually by leaving a number of seeding trees standing at the time of felling. In artificial regeneration a new stand is established on a clear-felled area, either through seeding or planting. Every year, over 160 million seedlings are planted in the forests to help to decrease the carbon dioxide emissions.

forest-lake-sky

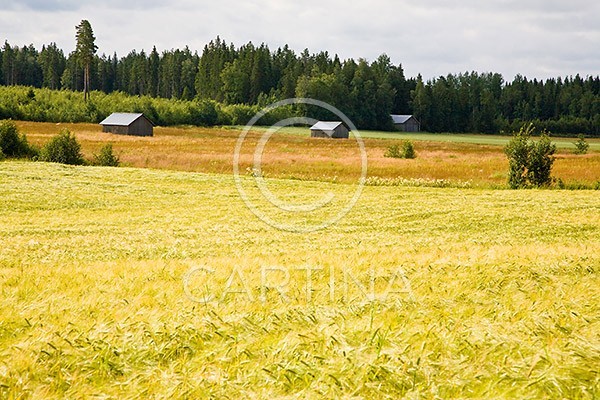
Besides forests the agriculture is also vulnerable to the changes o global climate. Climatic conditions are a decisive factor for the feasibility of crop production. Cultivation of wheat and oilseed plants is restricted to southern Finland, whereas barley, oats, grass and potato can be cultivated in most parts of the country. In many parts of Finland, livestock farming, especially dairy farming, is the only profitable agricultural production form. As a member of the EU, Finland follows the Common Agricultural Policy (CAP). The CAP is nationally implemented and aims to develop the agricultural production of the Union in a balanced way taking the environment and animal welfare into consideration. One important aim of the CAP is also to promote the vitality of rural areas.

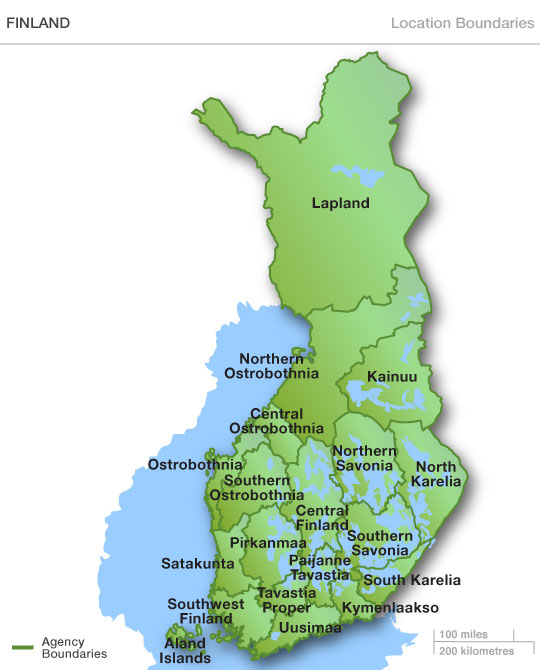
www.cartinafinland.fi

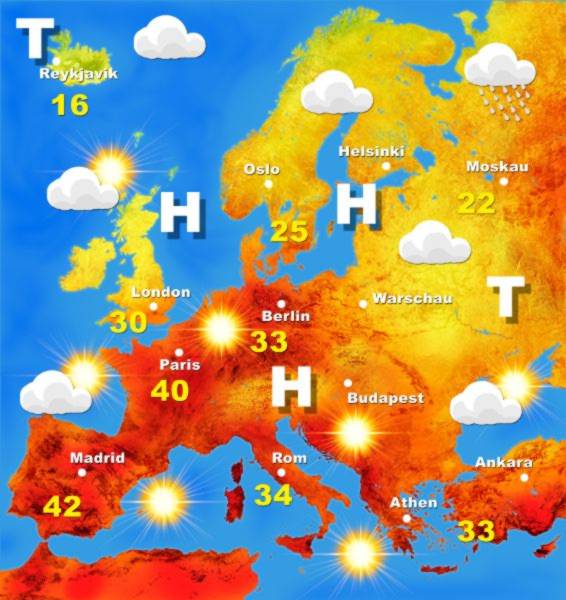
Reading the article from the ilcc reminded me of the summer 2003 in Europe. I remember how Europe was going crazy. The warm anomalies in June lasted throughout the entire month (increases in monthly mean temperature of up to 6 to 7°C). The hot and dry conditions led to many very large wildfires, in particular in Portugal. Also many major rivers  were at record low levels, resulting in disruption of inland navigation, irrigation and power-plant cooling. Even though Finland didn’t get as hot as the middle or south Europe the average monthly temperature still was higher than usual. The increase of temperature effected the agriculture the most. Berries that are huge in Finland during the summer were not available because it was too dry and hot for them to grow. It was a hard summer for Europe that is for sure.

Wetterkarte-Europa-Sommer2003

Finland is trying to make an effort towards mitigating climate change. In recent years consumers have been increasingly opting for large diesel cars. As a result, the energy efficiency of the entire new vehicle stock has not improved. A vehicle tax amendment which entered into force in Finland in the beginning of 2008 was expected to guide consumers towards choosing more energy-efficient vehicles and this luckily worked. The market share of public transport in proportion to the total volume of passenger transport has decreased steadily since 1990, being 15 per cent in 2007 and it is predicted to keep decreasing.  Besides the effort towards the public transportation Finland also uses solar and wind energy for example. Solar energy is used primarily for water heating and by the use of photovoltaics to generate electricity. In the end of 2011 wind energy share of total electricity consumption was 0.5%.

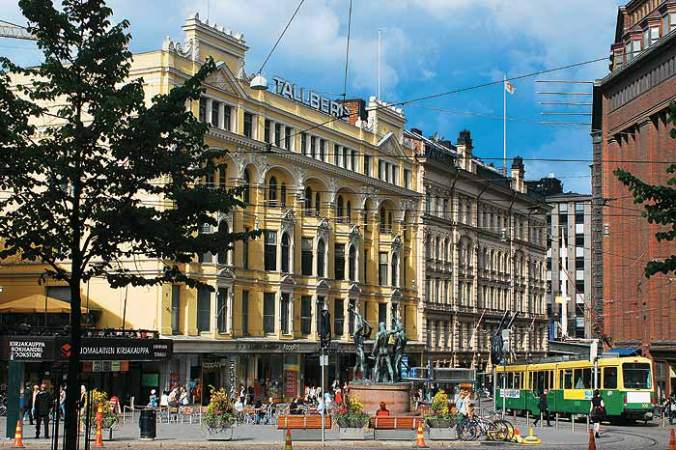
Ratikka12

As going through the Status of Ratification of the Kyoto Protocol I noticed that Finland did not ratify the protocol, but it did add “Annex I Party to the United Nations Framework Convention on Climate Change” like does few other countries as well.

Taking part of the clonal climate change is very important for people in Finland. It is part of the culture already as well as part of the way of living. People really think mitigation is important and they try to help as much as they can.

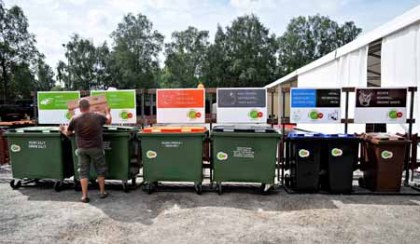
For my opinion Finland already does pretty good job with mitigation and adapting to climate change. They are planting more trees, getting more people to use public transportations, recycling and so on. The government tries to encourage people to recycle and on this clip theres a great example of one way how they do it and below there’s a great picture of how specific the recycling is in Finland.The Finns recycle nearly everything. At townhouses there is a shed with 6 different bins. Two are for newspapers; and the others are for corrugated cardboard, light cardboard (cereal boxes, milk cartons, etc.), organic garbage, and regular garbage. By separating everything there is mostly only one small bag of regular garbage per week. Plastic bottles, glass bottles, and aluminum cans are taken to the grocery store where people are paid rather handsomely for their efforts. Outside the grocery store are bins for plastic (Styrofoam, butter containers, etc.), paper (bills, ads, etc.), glass (jam and pickle jars, etc.), and tin cans. I sometimes got annoyed how you always have to separate everything but I understand the value of it. It might be a little more time consuming but at the end it pays off. One thing that Finland has been doing a long time and it actually was one of the first countries to take it into use is that you have to pay for plastic bags in grocery stores. Because of this people bring their own grocery bags to stores ore reuse most of the bags as trash bags.

SITA tidy event

At school they educate the students from early age about global climate change and how they can help prevent it. I remember how all the way from first grade and even before that we would always go through how to recycle and would have days that we would use to clean up the surrounding areas. Of course there is always room for improvement but I am sure Finland will keep up with this and try to mitigate and adapt to climate change even more.

On this website there is some more information about Finland and if you have any extra time or are interested you can check it out.

Thank you for reading my blog and for the great comments. Have a great summer break everyone!! 🙂

Climate Change Impacts

europe

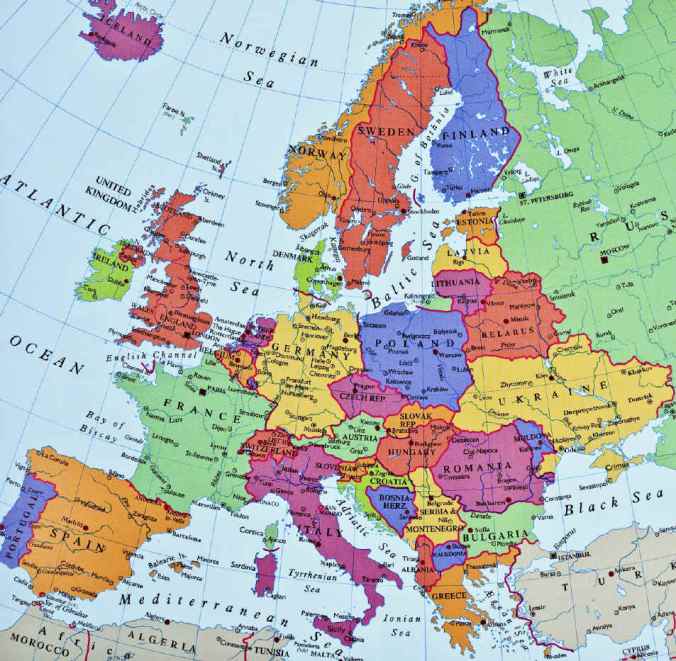
Finland is part of the European continent. Based on the ipcc the annual temperatures in Europe are likely to increase more than global mean. Warming in northern Europe (where Finland is located) is likely to be largest in winter an do to this there will be less snow accumulating. Besides this the annual precipitation is also very likely to increase in most northern Europe and also the daily precipitation in these areas can be expected to increase. On the ipcc’s website they make a great point that these uncertainties reflect the sensitivity of the European climate change to the magnitude of the global warming and the changes in the atmospheric circulation and the Atlantic Meridional Overturning Circulation. Europe owes has relatively mild climate, especially the north-western parts, and this is partly because the northward heat transport by Atlantic MOC. Europe that are presently snow-covered in winter, a decrease in snow cover is likely to induce a positive feedback, further amplifying the warming. If the greenhouse gas concentration increases this would lead to the weakening of the MOC and this on the other hand would reduce the warming in Europe. The website says that the simulated temperatures in the MMD models vary on both sides of the observational estimates in summer but are mostly lower than observed in the winter half-year, particularly in northern Europe. The seasonal area mean temperature biases in the northern Europe region vary from –5°C to 3°C. The average simulated precipitation in NEU exceeds that observed from autumn to spring. Even though the accuracy of the wind speed, an RCM simulated a very realistic wind climate over the North Sea, including the number and intensity of storms, when driven by analysed boundary conditions.

Winter-in-Helsinki-Finland

Climate change is expected to magnify regional differences in Europe’s natural resources and assets, still based on the information gotten from the ipcc. Negative impacts include increased risk of inland flash floods, and more frequent coastal flooding and increased erosion (due to storminess and sea-level rise). The majority of organisms and ecosystems will have difficulty adapting to these climate change. Areas with mountains will face glacier retreat, reduced snow cover and winter tourism, and extensive species losses. In Northern Europe, climate change is seen to bring mixed effects. Some benefits such as reduced demand for heating, increased crop yields and increased forest growth. But as climate change continues, its negative impacts (including more frequent winter floods, endangered ecosystems and increasing ground instability) are likely to outweigh its benefits. Europe also faces the risk of the possibility of flooding caused from the increase in precipitation and a rise in sea-levels . Another risk that Europe has to face is a decrease of the amount of water that is present, which can be caused by a major increase in temperatures. In addition, a major increase in the temperature is a possible risk which can effect for example farming.

Helsinki14_20100806

Ipcc’s text shows how different regions can experience totally different effects even though an increase in temperature can be expected to effect every region of Europe. Northern Europe will experience a rise in precipitation and Southern Europe will not. All these changes effect not only the human population, but also the animals. Heat epidemic is expected, but Southern Europe is going to see a lot more negative impacts effecting their environmental surroundings and other key components to a productive and functional society.

FinlandMain11


The biggest threat for Finland is the global warming. Like seen in the first picture (Helsinki during the winter), there is usually a lot of snow in Finland during the winter and the winters are usually also pretty long. The global warming is changing this and the winters in Finland aren’t as cold and long anymore. The summers (picture 2 of Helsinki during the summer) also are getting warmer and longer. The global warming is strongest in the northern part of Finland, Lapland. This part of the country is warming the fastest. The change of climate does effect so many things. Fro example changes to hunting and berry picking which are a huge part of the northerners life style.  The availability of food the other hand effect the reindeer husbandry and the climate changes pressure to change the land use, and the chain just keeps going on and on. Problems in southern Finland include changes to fishing and the changes in climate effect different kind of species, especially those who need long winters. One of these species is Saimaa ringed seal and they only exist in the lake of Saimaa, in Finland. Theres only approximately 310 of them left and do to the global climate change the number keeps dropping.

Finland’s contribution to climate change

draftThe CO2 emission sources for Finland are mostly from gas. Liquid and solid add to this a lot as well, even though the emission of liquid have been decreasing ever since from 1977. The total emission increased dramatically around 1959 and 1968. According to indexmundi. com Carbon dioxide emissions from liquid fuel consumption refer mainly to emissions from use of natural gas as an energy source. Based on their  ranking for countries CO2 emissions from gaseous fuel consumption, out of 113 countries US is ranked number one and Finland is ranked number 61.

Finland was a relative latecomer to industrialisation, remaining a largely agrarian country until the 1950s. This is the reason why Finland’s CO2 emissions started rising after 1950. Thereafter, it rapidly developed an advanced economy while building an extensive Nordic style welfare style. Subsequently, Finland is a top performer in numerous metrics of national performance, including education, economic competitiveness, civil liberties, quality of life, and human development In 2010, Newsweek magazine ranked Finland as the overall “best country in the world”. This was based on criteria of education, quality of life and health.

Finland

Compared the most recent per capita value to the United States citizen, which is 4.7 metric tons of carbon, Finland value is way lower. Finland’s value is approximately 0.67. Finland’s landscape is big part of it, with a lot of trees. The reason for this also partly lies on the way of living. Finnish people use more public transportation (this uses less energy and produces less pollution than comparable travel in private vehicles) as well as they also recycle way more than people in the United States.

Finlands graph lies right where USSR’s does and the reason for this is mostly because they are right next to watch other but also because Finland was part of Russian empire for 108 years. Brazil’s, India’s, Japan’s as well as Russian’s total fossil fuel emissions aren’t as high as for example the United States and China’s  because they are not industrial countries. India’s fossil fuel emission has started to rise though, because may companies has started to move their main factories over there because of the cheap labour. 

The United States and China both are big emitters of carbon dioxide and based on the most recent data available The United States emits more than China and this is very clear. China’s emissions compared to the US emissions is approximately  42.5%(0.425X100=42.50% Chinese emissions to US emissions) of the amount and this means US has 47.5% more than China. India’s emissions the other hand, when compared to the US emissions, is only about 11.7%(0.117X100=11.7% Indian emissions to US emissions) of the amount. This leaves the US at 88.3% more than India, which is alarming even though US is a lot bigger than India.

Lets say that US had 309,000,000 (4.71 per capita) people and China had 1,338,000,000 (1.68 per capita) people in 2010. This would mean that China emitted 2,247,840,000 Metric Tons of Carbon and the US emitted 1,455,390,000. The conclusion of this is that US citizen would be more at fault because the US and China are both emitting almost as much but the population of US is way lower, Us citizens should not be emitting this much.

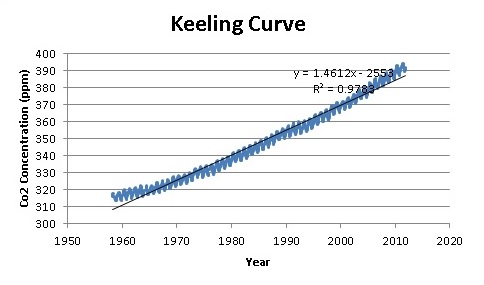
Keeling curveThe keeling curve  starts at the year of 1950 and the total fossil fuel emissions  graph  starts at about 1860. China still stands out as it shoots up around 1945 while the rest of the graphs are slowly either increasing or even decreasing.